
GCSE BIOLOGY REVISION: OSMOSIS
Please note: Text in colour is what the AQA GCSE biology specification requires an understanding of.
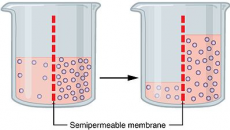
Water may move across cell membranes via osmosis. Osmosis is the diffusion of water from a dilute solution to a concentrated solution through a partially permeable membrane.
What is osmosis?
The movement of water molecules from a less concentrated solution (dilute) into a more concentrated one via a partially permeable membrane.
Note: It is very important to remember the partially permeable membrane whenever discussing osmosis. Often candidates will mistake diffusion with osmosis just because water is involved, if the question is discussing water but there is no partially permeable membrane then it is just diffusion.
Dilute solutions have:
Lower solute concentrations
Higher water concentrations
Concentrated solutions have:
Higher solute concentrations
Lower water concentrations
Key opportunities for skills development
Recognise, draw and interpret diagrams that model osmosis.
Key aspects to look out for when interpreting diagrams:
A partially permeable membrane
The concentration gradient
If there is a concentration gradient, one side will have more solutes than the other. The concentrated side will have more solutes, the dilute side will have less solutes.
If the numbers of solutes are roughly equal, there is no concentration gradient. Osmosis requires a concentration gradient.
When drawing a diagram to demonstrate osmosis:
You need an arrow to show which direction the water moves in
You must draw a dashed a line (- - - - - - -) to illustrate a partially permeable membrane
A key to explain what all aspects of the drawing mean
Solutes and water molecules easily distinguishable, solute molecules drawn bigger than water molecules is a good indication.
Students should be able to:
• use simple compound measures of rate of water uptake
• use percentages
• calculate percentage gain and loss of mass of plant tissue.
These are GCSE maths skills required to be applied in questions relating to biology.
Students should be able to plot, draw and interpret appropriate graphs.
More GCSE maths skills that need to be applied.
Plotted graphs must have labelled axis, a title to show what is being shown, the correct units, increments clearly and appropriately labelled, and a smooth line.
The positive percentages show an increased change in mass whilst the negative percentages show a reduction in mass.
When plotting this on a graph, you can then see where the change in mass is 0 (where the line hits 0 on the y axis.) This shows the concentration of sucrose in the item you are assessing on, for example a potato.
Required practical activity 3: investigate the effect of a range of concentrations of salt or sugar solutions on the mass of plant tissue.
The required practical aims to: Investigate the effect of a range of concentrations of salt or sugar solutions on the mass of plant tissue.
The best way to understand practical’s is to do it for yourself, and understand the theory through observation. Here is a useful video demonstrating a useful practical:
https://www.youtube.com/watch?v=gANAxRx58FY
image -https://www.google.co.uk/search?hl=en&biw=864&bih=713&tbm=isch&sa=1&ei=Y0CQW8rJK6iRgAbXz56QDg&q=osmosis&oq=osmosis&gs_l=img.1.0.35i39k1j0j0i67k1l2j0l2j0i67k1l3j0.147954.149652.0.150790.9.9.0.0.0.0.95.549.8.8.0....0...1c.1.64.img..1.8.549.0...0.79u-Pp3zqdM#imgrc=gPKaLy2_mqisyM:

0 Comment:
Be the first one to comment on this article.