
GCSE BIOLOGY REVISION: ORGANISATION OF AN ECOSYSTEM
Please note: Text in bold is what the AQA GCSE biology specification requires an understanding of.
In relation to abundance of organisms students should be able to:
understand the terms mean, mode and median
calculate arithmetic means
plot and draw appropriate graphs selecting appropriate scales for the axes.
Mean = the average calculated by adding all the data points and then dividing the total by the number of points. Data set example: 12, 14, 14, 18, 20. To calculate the mean = 12 + 14 + 14 + 18 + 20 = 78. 78/ 5 (number of points) = 15.6. You might not always get a simple number, sometimes examiners will tell you how to round the number (perhaps to one decimal place or to the next whole number) but in other cases you may be expected to make your own judgement. It is important to not round until the very end of the question, if you round in the middle of a sum, this will affect the precision of your results.
Mode= The number which appears most often. Data set example: 12, 14, 14, 18, 20. The answer is 14. However, exam questions may be a bit more difficult than this…
Median= The middle number. Data set example: 12, 14, 14, 18, 20. The answer is 14. An easy way to work this out is to calculate how many points you have, name this n. So we do n+1, divided by 2. So in this case we do 5 +1 = 6. 6/2 = 3. Therefore the median will be found in the 3rd position, i.e. number 14. In data sets where there are an even number of points, if we do n+1, divided by 2, we will get a fraction. For example: 12, 14, 14, 16, 18, 20. 6+1= 7. 7/2 = 3.5. The median is therefore halfway between the 3rd and 4th position, in this case between 14 and 16. The median is therefore 15.
You should be familiar with these terms from GCSE maths, if you can do a GCSE maths question on this topic, then you can definitely do a biology one! If not, do not worry. Practice makes perfect, there are plenty of biological statistical questions available online!
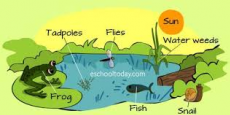
Producers are eaten by primary consumers, which in turn may be eaten by secondary consumers and then tertiary consumers.
For example:
Producer à primary consumer à secondary consumer à tertiary consumer
Grass à grasshopper à rat à snake
Algae à mosquito larva à dragonfly larva à fish
Primary consumers are herbivores.
Consumers that kill and eat other animals are predators, and those eaten are prey. In a stable community the numbers of predators and prey rise and fall in cycles.
Notes on this part of the specification have been previously discussed in a previous article.
Interpret graphs used to model predator-prey cycles.
Students should be able to interpret graphs used to model these cycles.
Image- https://eschooltoday.com/ecosystems/what-is-an-ecosystem.html

0 Comment:
Be the first one to comment on this article.